


Overview
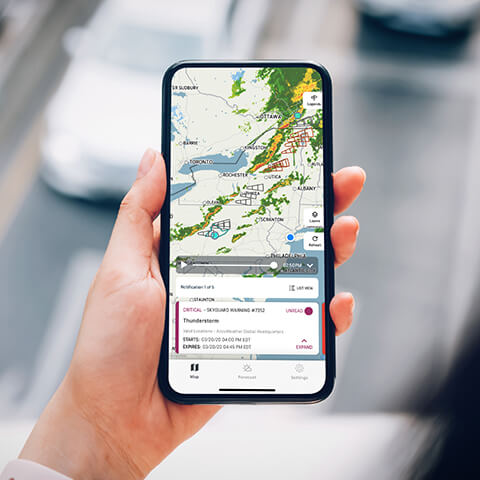
Safeguard with SkyGuard®
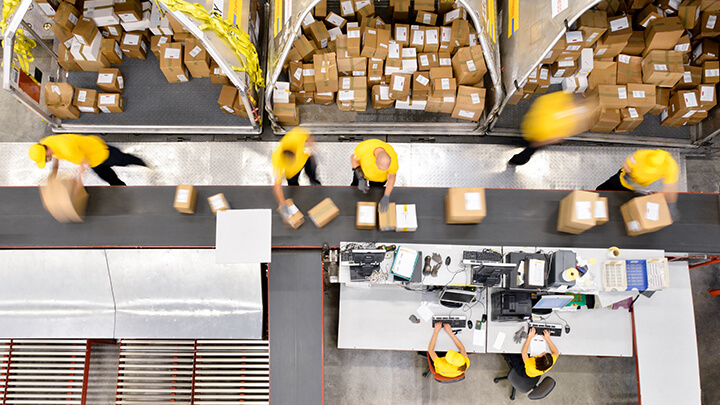
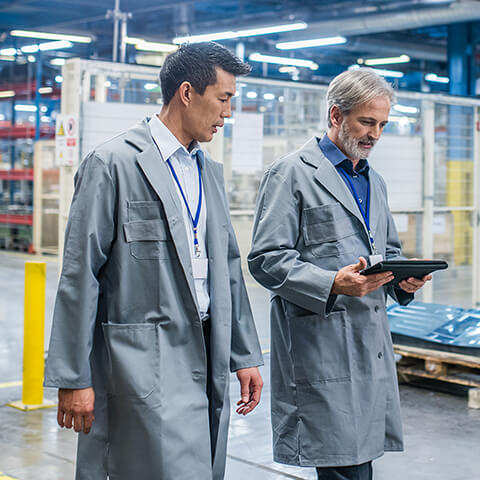
Industries
We work to support your business


We make lives simpler, safer, and better for more than 1.5 billion people.
Access the latest resources from AccuWeather.
Get the latest updates from AccuWeather.
For Business
For Business
Overview

Industries
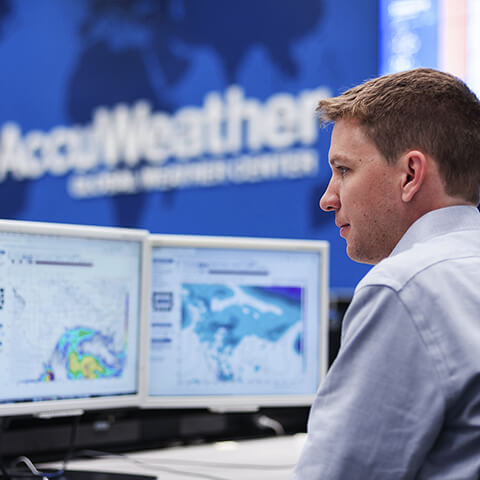
Our highly-skilled business weather experts combine the latest applied science with industry best practices to tailor a solution that works for you.
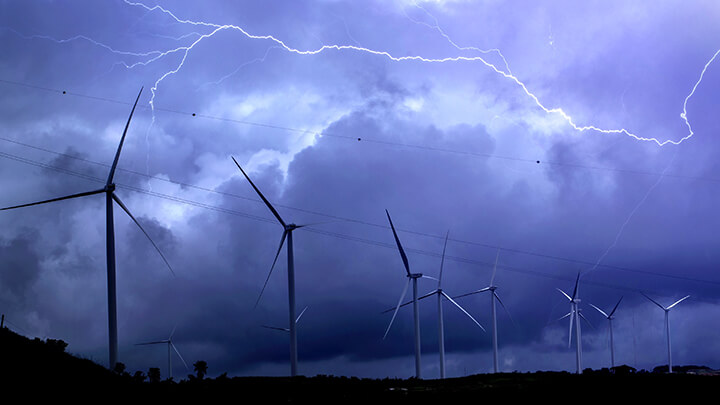
Protection
More than half of the Fortune 500 rely on AccuWeather’s Superior Accuracy™.
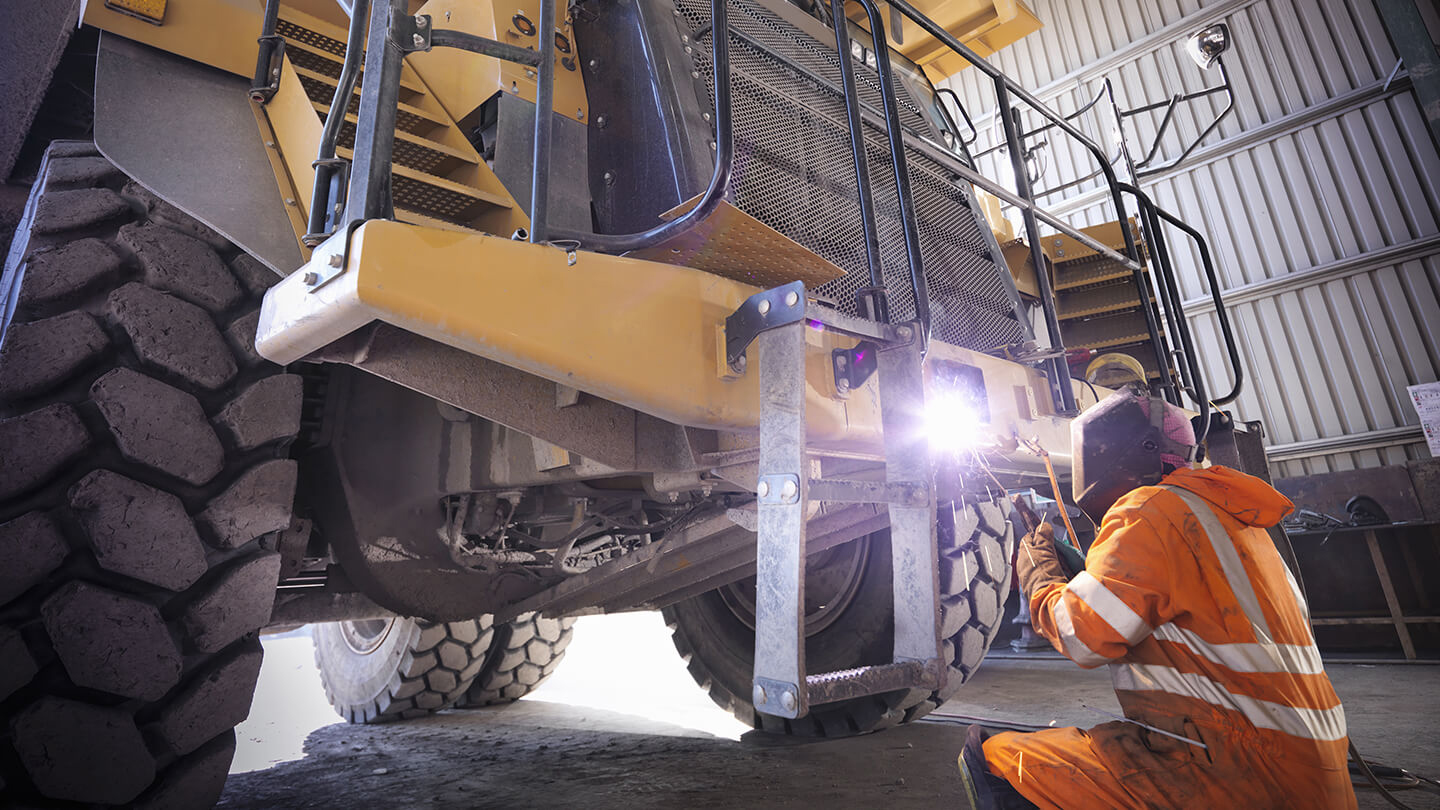
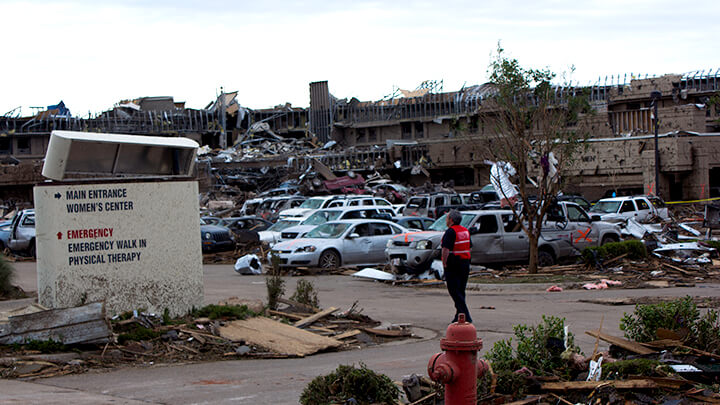
AccuWeather issued the world’s largest construction equipment manufacturer a tornado warning that saved 88 people when there were no other warnings from any other source.
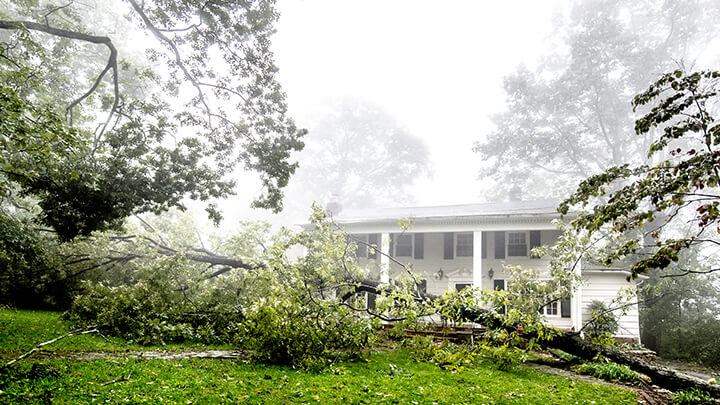
AccuWeather provided notice days in advance for Category 5 Hurricane Michael. Clients responds, “You and your staff are always great, with first rate information.”
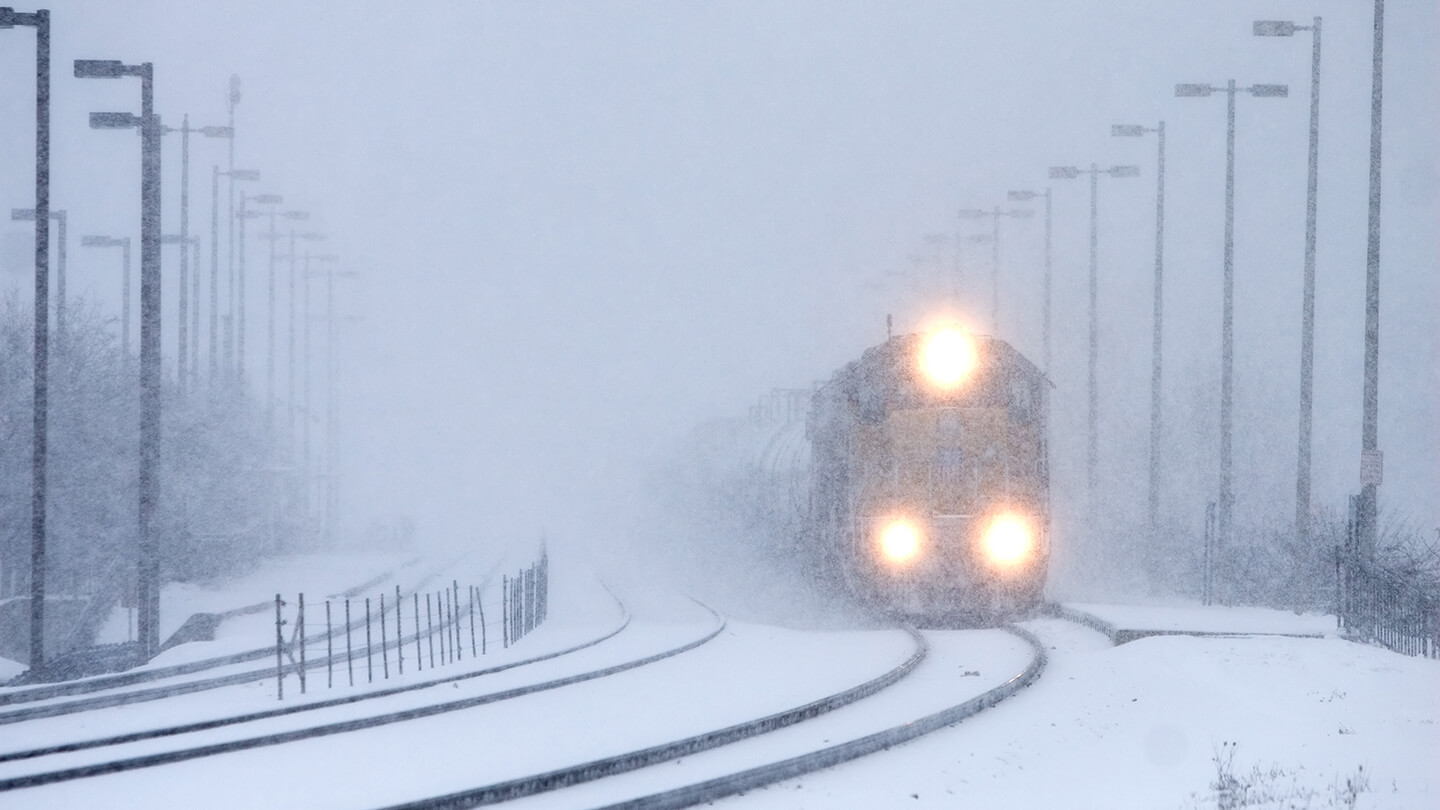
When an early October snow blanketed Manitoba, Canada and caught many off-guard, one of AccuWeather’s railroad clients was prepared thanks to a detailed forecast that called for an unusually early snowstorm several days in advance.

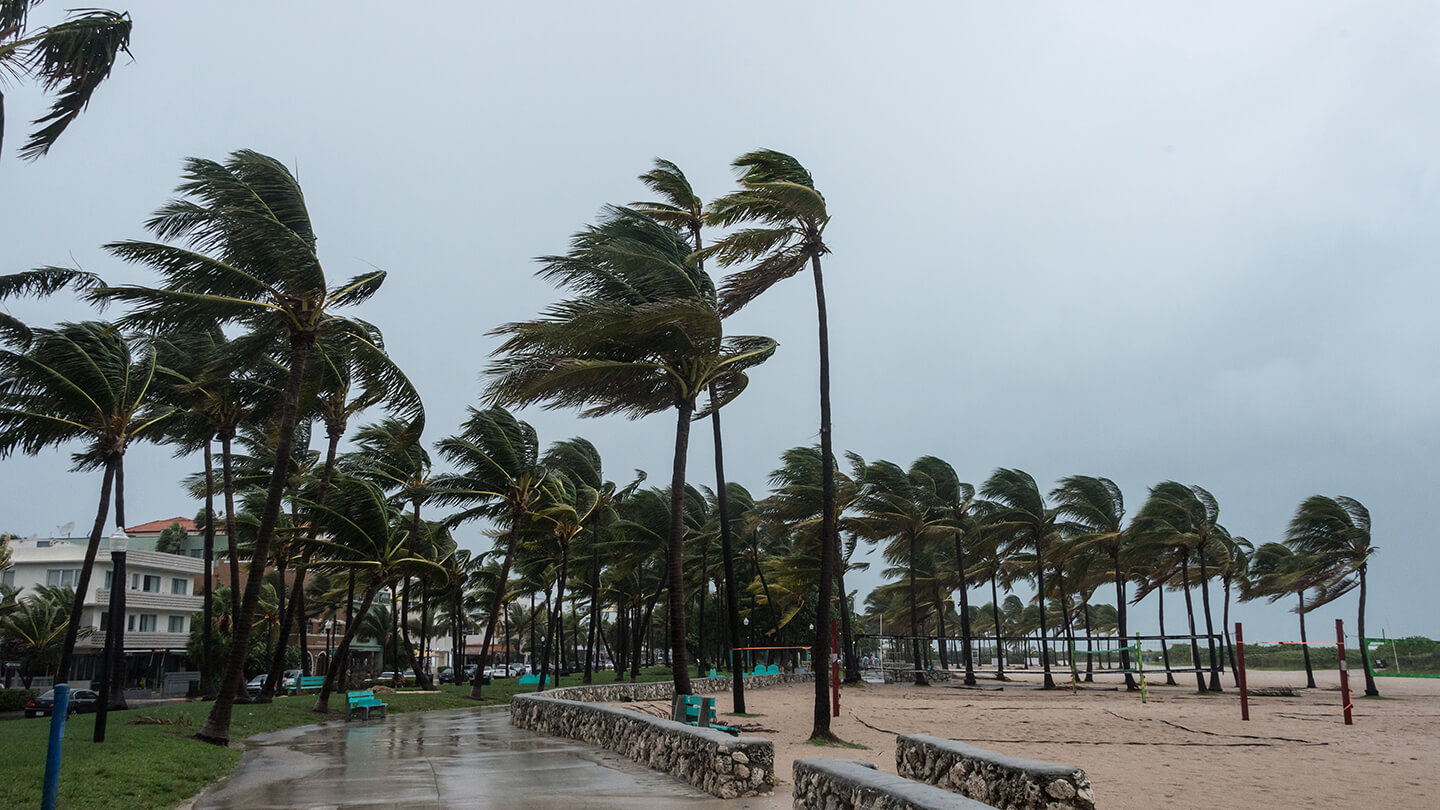
When gusty winds hit a 4th of July Celebration in Thornton, Colorado, AccuWeather provided proactive warnings to an event traffic and solutions company, helping to avoid injuries and damage to equipment.